For most of the history of education, school leaders managed their institutions by instinct, experience, and whatever data they could manually compile from disparate registers, grade books, and staff reports. That era is ending.
The Visibility Problem in School Management
Ask most principals or administrators what their current attendance rate is — not last month’s figure, but today’s, right now — and they’ll pause. Ask them which three teachers have the highest student engagement rates. Ask them which students are most at risk of failing their end-of-year assessments based on current performance trends.
These are not exotic questions. They’re the basic inputs that effective school management requires. But without a real-time data system, they’re nearly impossible to answer quickly.
What Good Analytics Looks Like
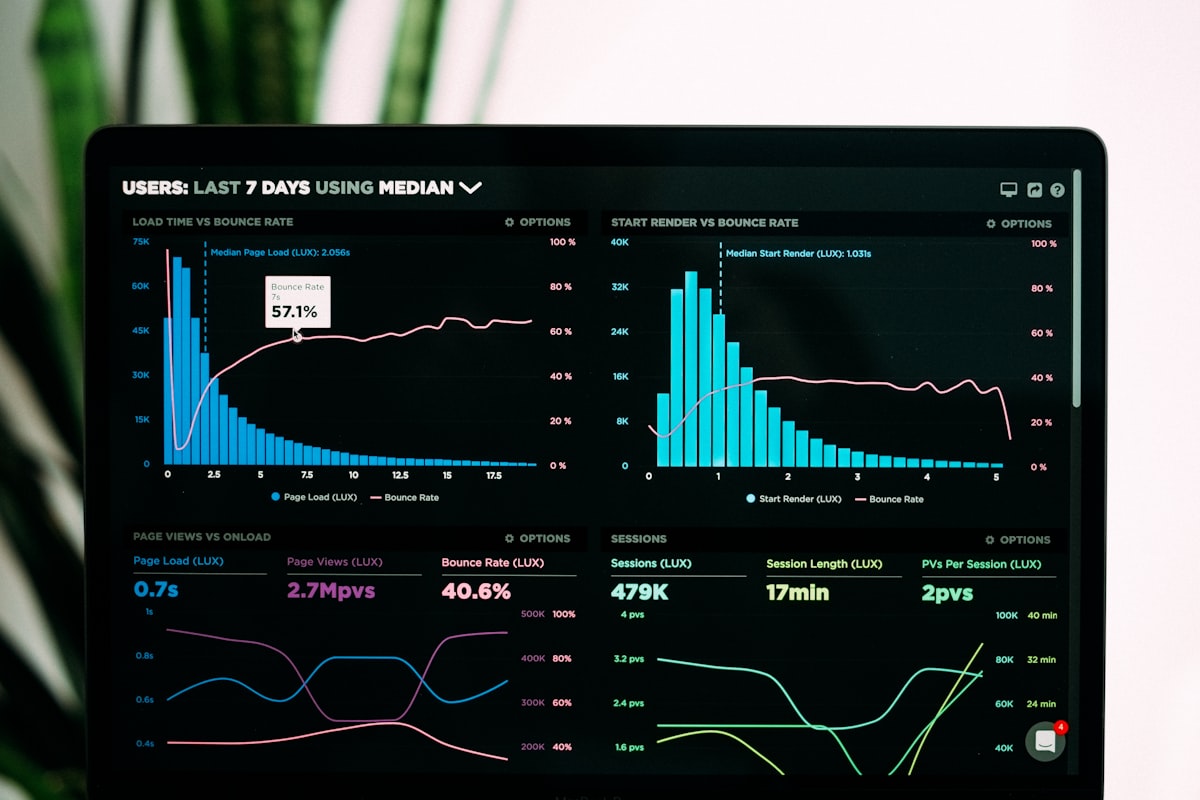
TedQu’s Analytics Dashboard aggregates data from every part of the platform — attendance, quiz performance, assessment results, engagement rates, parent communication — and surfaces it in a single, role-appropriate interface.
A teacher sees their class-level data. A head of department sees trends across their subject area. A principal sees school-wide patterns. A board member sees the strategic metrics that matter for governance and accreditation reporting.
Early Intervention: The Most Valuable Use of Data
The feature TedQu users consistently cite as most transformative is the early intervention flag. The system monitors each student’s performance across all tracked dimensions — attendance, quiz scores, assessment results, engagement patterns — and automatically surfaces students whose trajectory suggests they are at risk of falling significantly behind.
This flag appears on the teacher’s dashboard before the student has failed anything. It appears when the pattern starts — not when the crisis arrives. Early intervention at this stage is dramatically more effective and less costly than remediation after failure.
“We could finally identify students who were consistently missing concepts — before they failed. The analytics dashboard is a game-changer for school management.”
— Marcus Reid, Principal, Greenfield Academy
The Accreditation Evidence Problem — Solved
International accreditation bodies require evidence of student learning outcomes, data-driven teaching practices, and systematic monitoring of academic progress. Compiling this evidence manually is one of the most time-consuming aspects of the accreditation process.
TedQu’s analytics engine generates accreditation-ready reports automatically. The data is always current, always structured, and always exportable in the formats that accreditation bodies require.
Comparing Performance: Class, Year Group, and Institution Level
One of the most actionable features of TedQu’s dashboard is the performance comparison view. Administrators can see how a specific class compares to the year group average, how the year group compares to the institutional benchmark, and how this year’s results compare to the same period last year.
This comparative data is the foundation of effective quality assurance — and it’s generated automatically without any additional data entry.
From Lagging to Leading Indicators
Traditional school reporting is backward-looking: exam results tell you what students knew in June. TedQu’s analytics are forward-looking: engagement patterns, attendance trends, and in-class quiz performance tell you what is likely to happen in June — with enough lead time to change the outcome.
This shift from lagging to leading indicators is the difference between managing outcomes and managing inputs. It’s the difference between reactive and proactive school leadership.